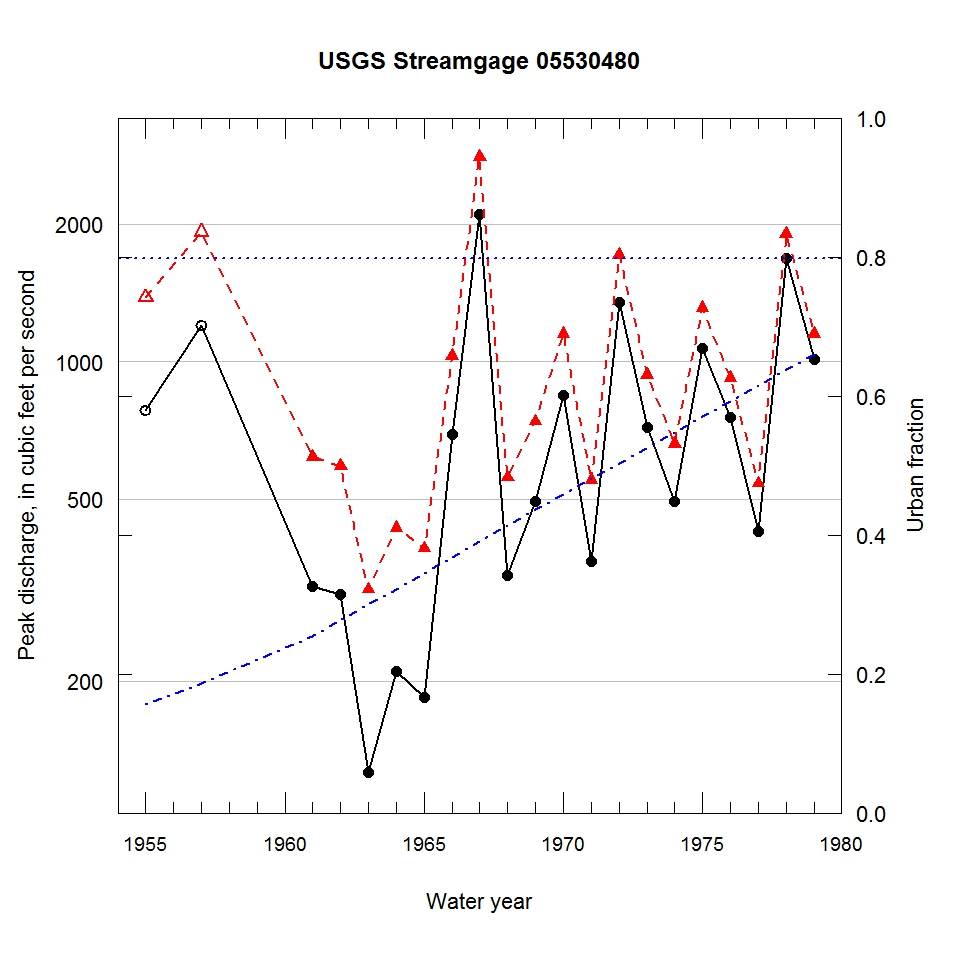
Observed and urbanization-adjusted annual maximum peak discharge and associated urban fraction and precipitation values at USGS streamgage:
05530480 WILLOW CREEK AT ORCHARD PLACE, IL


| Water year | Segment | Discharge code | Cumulative reservoir storage (acre-feet) | Urban fraction | Precipitation (inches) | Observed peak discharge (ft3/s) | Adjusted peak discharge (ft3/s) | Exceedance probability |
| 1955 | 1 | 7 | 0 | 0.156 | 3.790 | 782 | 1380 | 0.074 |
| 1957 | 1 | 7 | 0 | 0.186 | 3.379 | 1200 | 1920 | 0.020 |
| 1961 | 1 | -- | 0 | 0.254 | 2.033 | 322 | 619 | 0.656 |
| 1962 | 1 | -- | 0 | 0.277 | 0.180 | 310 | 591 | 0.698 |
| 1963 | 1 | -- | 0 | 0.299 | 1.605 | 126 | 317 | 0.958 |
| 1964 | 1 | -- | 0 | 0.322 | 1.141 | 210 | 433 | 0.886 |
| 1965 | 1 | -- | 0 | 0.345 | 0.185 | 184 | 390 | 0.925 |
| 1966 | 1 | -- | 0 | 0.368 | 2.173 | 692 | 1030 | 0.193 |
| 1967 | 1 | -- | 0 | 0.391 | 2.459 | 2100 | 2800 | 0.007 |
| 1968 | 1 | -- | 0 | 0.413 | 2.564 | 340 | 558 | 0.745 |
| 1969 | 1 | -- | 0 | 0.436 | 1.416 | 494 | 740 | 0.494 |
| 1970 | 1 | -- | 0 | 0.459 | 1.259 | 845 | 1150 | 0.143 |
| 1971 | 1 | -- | 0 | 0.481 | 1.616 | 366 | 551 | 0.752 |
| 1972 | 1 | -- | 0 | 0.504 | 1.830 | 1350 | 1710 | 0.034 |
| 1973 | 1 | -- | 0 | 0.526 | 0.899 | 718 | 936 | 0.265 |
| 1974 | 1 | -- | 0 | 0.548 | 0.791 | 494 | 661 | 0.601 |
| 1975 | 1 | 2 | 0 | 0.571 | 1.559 | 1070 | 1310 | 0.088 |
| 1976 | 1 | -- | 0 | 0.593 | 1.227 | 754 | 922 | 0.277 |
| 1977 | 1 | -- | 0 | 0.615 | 1.213 | 426 | 541 | 0.764 |
| 1978 | 1 | -- | 0 | 0.638 | 2.303 | 1680 | 1900 | 0.023 |
| 1979 | 1 | -- | 0 | 0.660 | 1.358 | 1010 | 1150 | 0.147 |

